A small tutorial that explains how you can clip map tile layers based on an external GeoJSON boundary in Leaflet.
When designing maps for our projects here at KLL, a very common request that we receive in the early stages of development of any map-based app, is to make the geographical area that is the focus of the project stand out.
In this post, I am going to walk you through a series of steps that will allow you to clip the standard OSM tilelayer based on a geographic boundary.
So what are we doing again?
Here is an image that showcases what we are trying to achieve by the end of this tutorial.
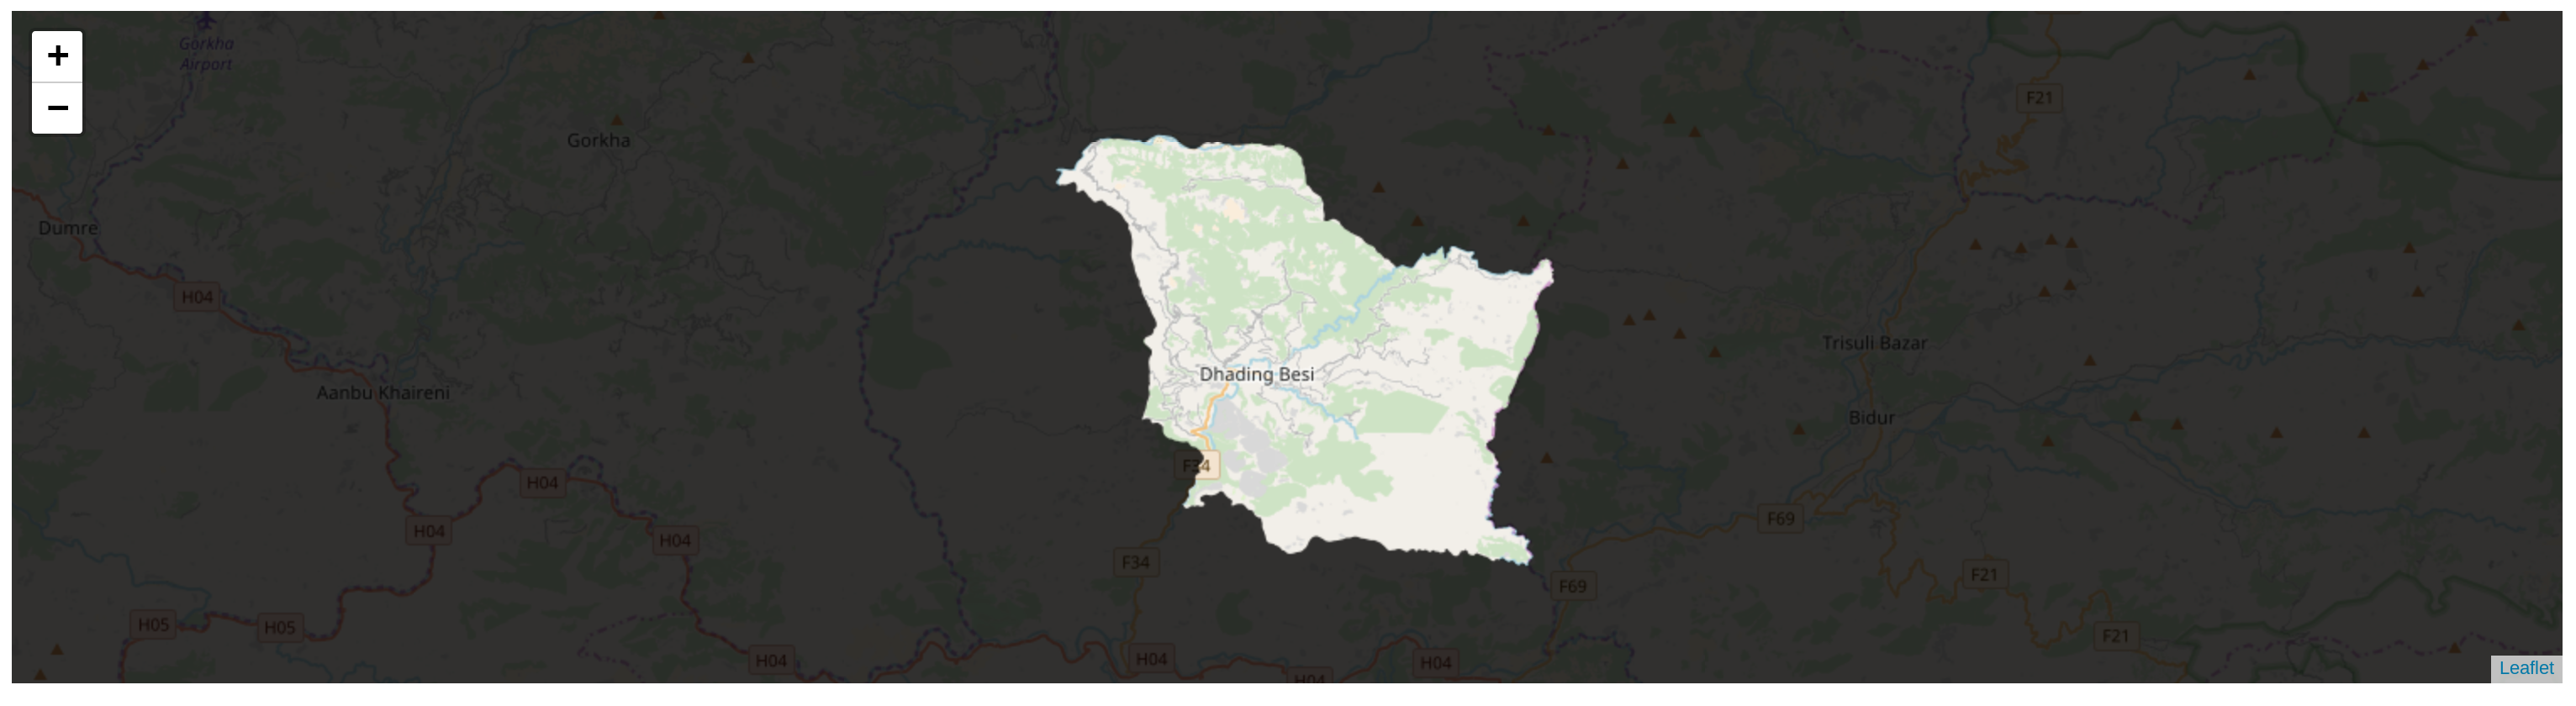 Notice how areas outside the city has a reduced opacity, allowing us to draw the user’s attention to all of the content inside the boundary.
Before we begin
This tutorial assumes a basic understanding of LeafletJS and its API. If you are not familiar with this framework, I urge you to go through its well curated collection of tutorials and API reference documentation.
I have also uploaded all of the resources used for this tutorial in the form of a github gist. You can view the code in this github gist.
Step 1: Wiring up a basic map
Let’s start by quickly wiring up a basic leaflet map for our use. For this, we will be following the same procedure as outlined in Leaflet’s official quick start guide, with the following differences:
- The bounding box and the zoom level will be set to around that of Neelakantha municipality.
- The tilelayer that we will be using will be different to the one provided in the guide.
<!DOCTYPE html>
<html lang="en" dir="ltr">
<head>
<meta charset="utf-8">
<!-- Loading leaflet JS styles and JS -->
<link rel="stylesheet" href="https://unpkg.com/leaflet@1.3.1/dist/leaflet.css" integrity="sha512-Rksm5RenBEKSKFjgI3a41vrjkw4EVPlJ3+OiI65vTjIdo9brlAacEuKOiQ5OFh7cOI1bkDwLqdLw3Zg0cRJAAQ==" crossorigin="" />
<script src="https://unpkg.com/leaflet@1.3.1/dist/leaflet.js" integrity="sha512-/Nsx9X4HebavoBvEBuyp3I7od5tA0UzAxs+j83KgC8PU0kgB4XiK4Lfe4y4cgBtaRJQEIFCW+oC506aPT2L1zw==" crossorigin=""></script>
<!-- End loading Leaflet JS -->
<title>Making Cities Pop - Final Output</title>
</head>
<body>
<!-- Create a div where the map will reside -->
<div id="my-map" style="height:400px;"></div>
<script>
var mymap = L.map('my-map').setView([27.89512, 85.1], 11);
</script>
</body>
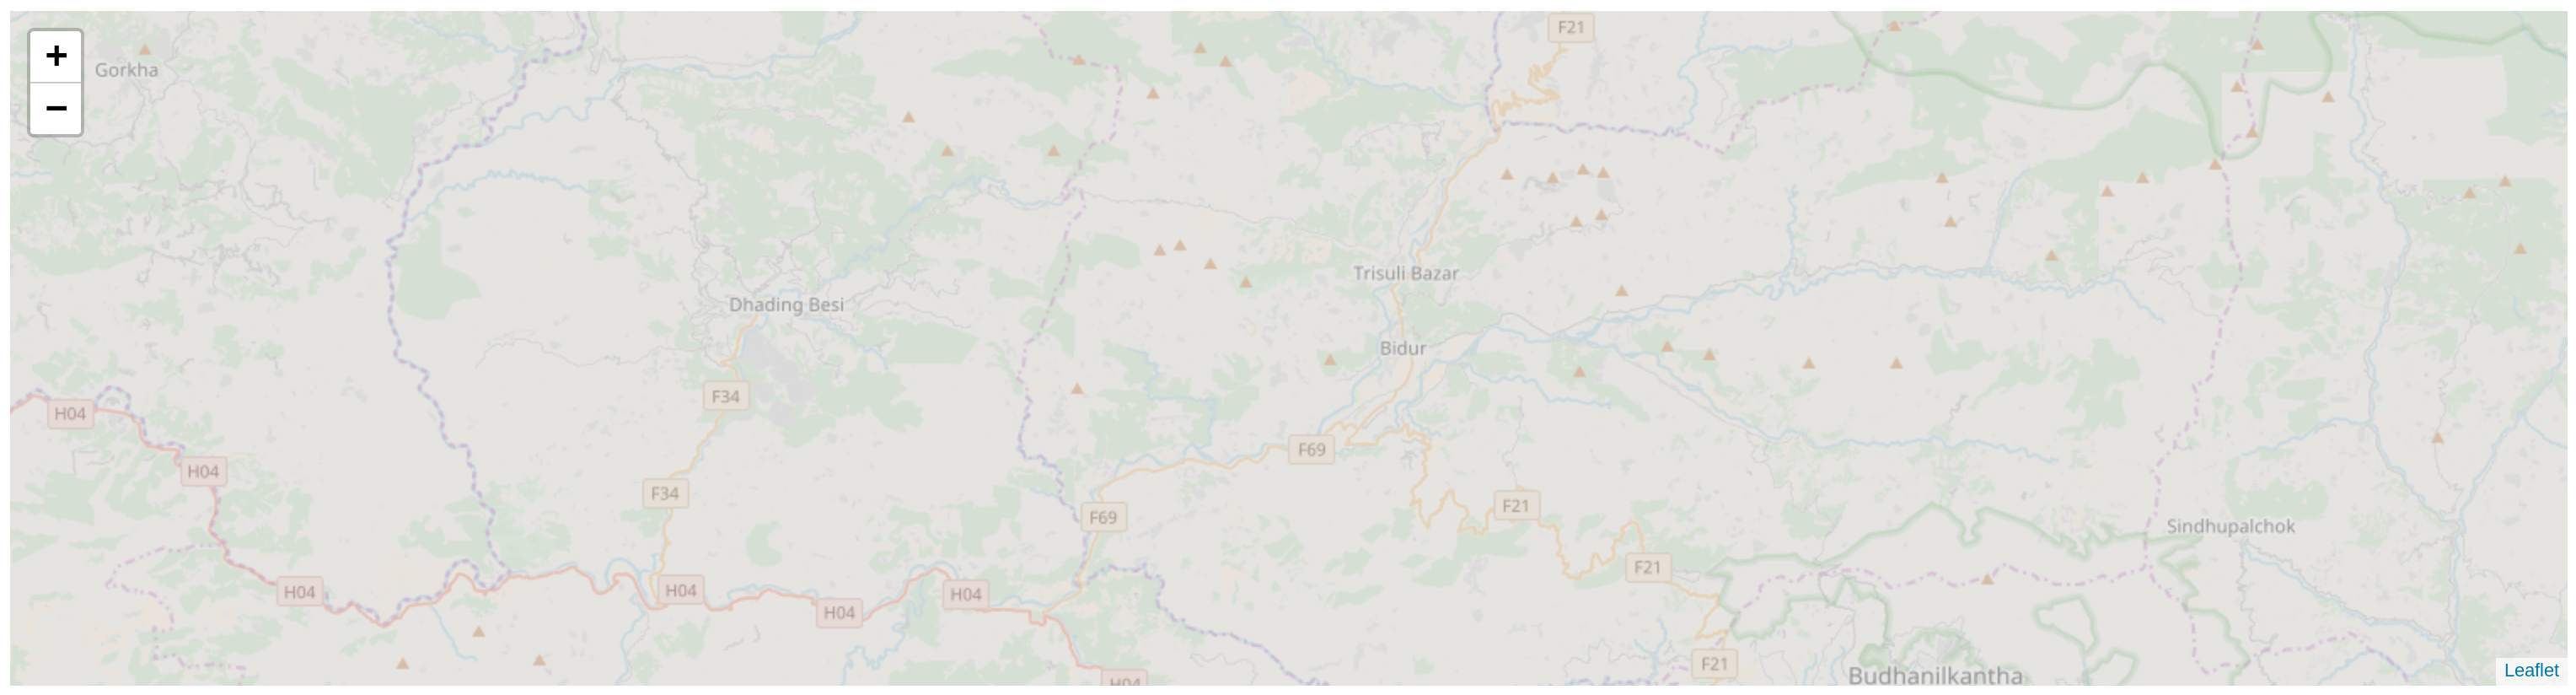
</html>Before we proceed, here’s a screenshot of what the output currently looks like:
 As you may have noticed, not much has happened so far.
Step 2: Adding the base tile layer
Inside the script tag, we now create a new tile layer and add it to the map as follows.
...

<script>
  var mymap = L.map('my-map').setView([27.89512, 85.1], 11);

  var osmURL = 'https://{s}.tile.openstreetmap.org/{z}/{x}/{y}.png'
  var baseTileLayer = L.tileLayer(osmURL, { opacity: 0.2 });
  baseTileLayer.addTo(mymap);
</script>

...
Notice how I’ve set the opacity of baseTileLayer to 0.2. Here’s what the output looks like now:
Step 3: Loading the external GeoJSON boundary.
The next step involves making the GeoJSON boundary file available for use within our index.html. For this we will have to make use of the $.ajax() method available in jQuery. To do so, we first load jQuery as an external dependency onto the head section of our document, like so:
...
<head>
  ...
  <script src="https://code.jquery.com/jquery-2.2.4.js"></script>
  ...
</head>
...
After this, we can now access the GeoJSON as follows:
...

<script>
  var mymap = L.map('my-map').setView([27.89512, 85.1], 11);
  var osmURL = 'https://{s}.tile.openstreetmap.org/{z}/{x}/{y}.png'
  var baseTileLayer = L.tileLayer(osmURL, { opacity: 0.4 });
  baseTileLayer.addTo(mymap);


  $.ajax({mimeType: 'application/json', url: 'boundary.geojson'} ).done(function(data) {
    console.log(data)
  });
</script>

...
Step 4: Making it pop!
The final step involves adding one more tilelayer onto the original map. However, in this case, the tile layer will only be visible inside the boundary. This is achieved my making use of an external leaflet plugin called ‘BoundaryCanvas’, which allows us to draw tiled raster layers with an arbitrary boundary (in our case, boundary.geojson). You can learn more about its capabilities here.
We begin by loading the boundary canvas script within the head section of index.html.
...
<head>
  ...
      <script src="https://unpkg.com/leaflet-boundary-canvas@1.0.0/src/BoundaryCanvas.js"></script>
  ...
</head>
...
Finally, we add the additional tile layer inside the $.ajax() call as follows:
...

<script>

  var mymap = L.map('my-map').setView([27.89512, 85.1], 11);
  var osmURL = 'https://{s}.tile.openstreetmap.org/{z}/{x}/{y}.png'
  var baseTileLayer = L.tileLayer(osmURL, { opacity: 0.2 });
  baseTileLayer.addTo(mymap);

  $.ajax({mimeType: 'application/json', url: 'boundary.geojson'} ).done(function(data) {
    var test = L.TileLayer.boundaryCanvas('https://{s}.tile.openstreetmap.org/{z}/{x}/{y}.png', {
        boundary: data,
    }).addTo(mymap);
  });

</script>

...
If all goes well, here’s what you will see:

To make the municipality stand out a little more, let’s modify the leaflet container’s background color. To do this, let’s add a style tag inside the <head> section of index.html
...
<head>
  ...
  <style>
     .leaflet-container {
       background: #000;
     }
  </style>
  ...
</head>
...
In the end, this is what we should have:
Cheers, Arogya